


JProfiler x64 for Windows 7 - Boost Your Application Performance - Windows 7 Download

JProfiler x64 14.0.3
"Gain insight into your code's behavior with JProfiler x64 software."
If you're a developer looking for the ultimate tool to optimize your Java applications, JProfiler x64 by ej-technologies GmbH is an absolute must-have. This powerful software provides you with real-time code analysis, allowing you to identify and troubleshoot any issues in mere seconds. With its user-friendly interface and extensive array of features, JProfiler x64 is the perfect choice for developers looking to streamline their workflow and enhance the performance of their Java apps. Download your copy today and discover why JProfiler x64 is the go-to solution for Java devs worldwide!
JProfiler x64 14.0.3 full details

| File Size: | 107.00 MB |
|---|---|
| License: | Trialware |
| Price: | $499.00 |
| Released: | 2024-05-22 |
| Downloads: | Total: 1469 | This Month: 81 |
| Publisher: | ej-technologies GmbH |
| Publisher URL: | https://www.ej-technologies.com/ |

Download JProfiler x64 14.0.3
Save JProfiler x64 to My Stuff
Tweet
JProfiler x64 14.0.3 full screenshots
JProfiler x64 - Windows 7 Download awards


JProfiler x64 14.0.3 full description
JProfiler x64 is an award-winning all-in-one Java profiler. JProfiler's intuitive GUI helps you find performance bottlenecks, pin down memory leaks and resolve threading issues.
JProfiler supports the following modes of operation:
Live profiling of a local session
Once you define how your application is started, JProfiler can profile it and you immediately see live data from the profiled JVM. To eliminate the need for session configuration, you can use one of the many IDE plugins to profile the application from within your favorite IDE.
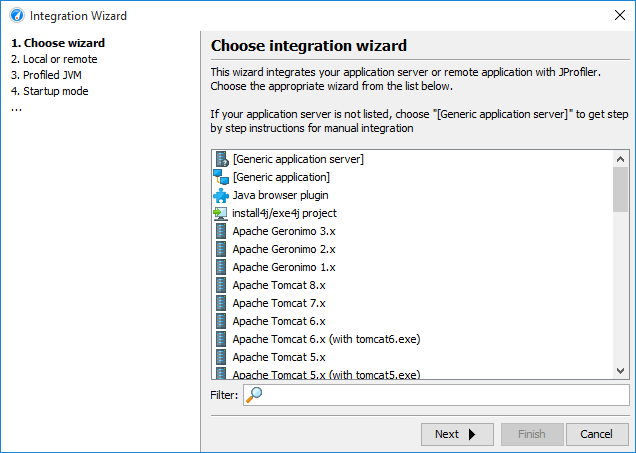
Live profiling of a remote session
By modifying the VM parameters of the java start command you can get any Java application to listen for a connection from the JProfiler GUI. The profiled application can not only run on your local computer, JProfiler can attach to a profiled application over the network. In addition, JProfiler provides numerous integration wizards for all popular application servers that help you in setting up your application for profiling.
Offline profiling
You do not have to connect with the JProfiler GUI to the profiled application in order to profile it: With offline profiling you can use JProfiler's powerful trigger system or the JProfiler API to control the profiling agent and save snapshots to disk. At a later time you can open these snapshots in the JProfiler GUI or programmatically export profiling views with the command line export tool or the export ant task.
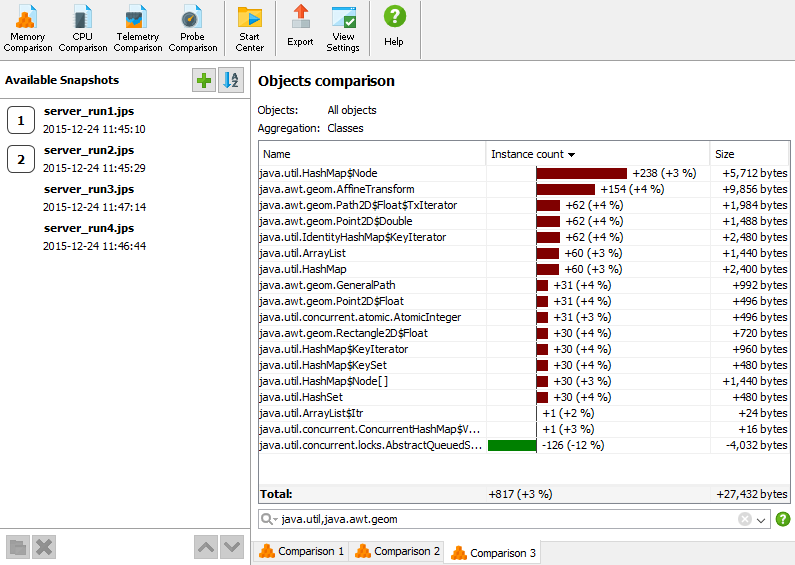
Snapshot comparisons
In JProfiler, you can save a snapshot of all current profiling data to disk. JProfiler offers a rich comparison facility to see what has changed between two or more snapshots. Alternatively you can create comparison reports programmatically with the command line comparison tool or the comparison ant task.
Viewing an HPROF snapshot
JProfiler can open HPROF snapshots that have been taken with JVM tools such as jconsole or jmap or that have been triggerd by the -XX:+HeapDumpOnOutOfMemoryError JVM parameter.
The following list gives a high level overview of the profiling views in JProfiler:
Memory profiling
JProfiler's memory view section offers dynamically updated views on memory usage and views that show information about allocations spots. All views have several aggregation levels and can show live and garbage collected objects.
All objects
Shows classes or packages of all objects on the heap with instance counts and size information. You can mark current values and show differences.
Recorded objects
Shows classes or packages of all recorded objects. You can mark current values and show differences.
Allocation call tree
Shows a call tree or methods, classes, packages or Java EE components with annotated allocations of selected classes.
Allocation hot spots
Shows a list of methods, classes, packages or Java EE components that allocate selected classes. You can mark current values and show differences. The tree of backtraces can be shown for each hot spot.
Class tracker
Shows a timeline with a graph of instance counts for selected classes.
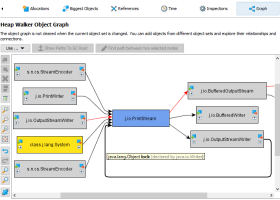
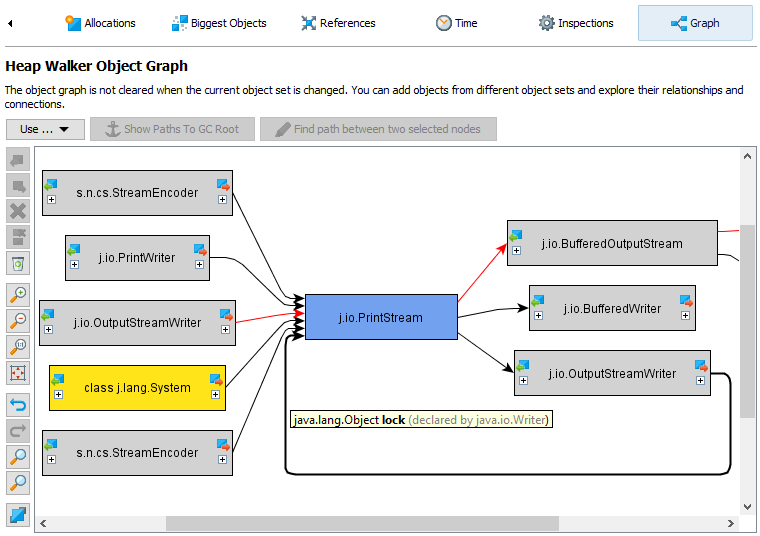
Heap walker
In JProfiler's heap walker you can take a snapshot of the heap and drill down to objects of interest by performing selection steps. The heap walker has five views:
Classes
Shows all classes and their instances.
Allocations
Shows allocation tree and allocation hot spots for recorded objects.
Biggest objects
Shows the objects that block the largest parts of the heap from being garbage collected. The dominator tree can be expanded in place to show these retained objects.
References
Shows a graph of references for individual objects and offers a "show path to garbage collector root" functionality. Also offers cumulated views for incoming and outgoing references.
Data
Shows instance and class data for individual objects.
Time
Shows a time-resolved histogram of recorded objects.
JProfiler supports the following modes of operation:
Live profiling of a local session
Once you define how your application is started, JProfiler can profile it and you immediately see live data from the profiled JVM. To eliminate the need for session configuration, you can use one of the many IDE plugins to profile the application from within your favorite IDE.
Live profiling of a remote session
By modifying the VM parameters of the java start command you can get any Java application to listen for a connection from the JProfiler GUI. The profiled application can not only run on your local computer, JProfiler can attach to a profiled application over the network. In addition, JProfiler provides numerous integration wizards for all popular application servers that help you in setting up your application for profiling.
Offline profiling
You do not have to connect with the JProfiler GUI to the profiled application in order to profile it: With offline profiling you can use JProfiler's powerful trigger system or the JProfiler API to control the profiling agent and save snapshots to disk. At a later time you can open these snapshots in the JProfiler GUI or programmatically export profiling views with the command line export tool or the export ant task.
Snapshot comparisons
In JProfiler, you can save a snapshot of all current profiling data to disk. JProfiler offers a rich comparison facility to see what has changed between two or more snapshots. Alternatively you can create comparison reports programmatically with the command line comparison tool or the comparison ant task.
Viewing an HPROF snapshot
JProfiler can open HPROF snapshots that have been taken with JVM tools such as jconsole or jmap or that have been triggerd by the -XX:+HeapDumpOnOutOfMemoryError JVM parameter.
The following list gives a high level overview of the profiling views in JProfiler:
Memory profiling
JProfiler's memory view section offers dynamically updated views on memory usage and views that show information about allocations spots. All views have several aggregation levels and can show live and garbage collected objects.
All objects
Shows classes or packages of all objects on the heap with instance counts and size information. You can mark current values and show differences.
Recorded objects
Shows classes or packages of all recorded objects. You can mark current values and show differences.
Allocation call tree
Shows a call tree or methods, classes, packages or Java EE components with annotated allocations of selected classes.
Allocation hot spots
Shows a list of methods, classes, packages or Java EE components that allocate selected classes. You can mark current values and show differences. The tree of backtraces can be shown for each hot spot.
Class tracker
Shows a timeline with a graph of instance counts for selected classes.
Heap walker
In JProfiler's heap walker you can take a snapshot of the heap and drill down to objects of interest by performing selection steps. The heap walker has five views:
Classes
Shows all classes and their instances.
Allocations
Shows allocation tree and allocation hot spots for recorded objects.
Biggest objects
Shows the objects that block the largest parts of the heap from being garbage collected. The dominator tree can be expanded in place to show these retained objects.
References
Shows a graph of references for individual objects and offers a "show path to garbage collector root" functionality. Also offers cumulated views for incoming and outgoing references.
Data
Shows instance and class data for individual objects.
Time
Shows a time-resolved histogram of recorded objects.
JProfiler x64 14.0.3 download tags
Bookmark JProfiler x64
JProfiler x64 for Windows 7 - Copyright information
All JProfiler x64 reviews, submitted ratings and written comments become the sole property of Windows 7 download. You acknowledge that you, not windows7download, are responsible for the contents of your submission. However, windows7download reserves the right to remove or refuse to post any submission for any reason.
Windows 7 Download periodically updates pricing and software information of JProfiler x64 full version from the publisher, but some information may be out-of-date. You should confirm all information.
Using warez version, crack, warez passwords, patches, serial numbers, registration codes, key generator, pirate key, keymaker or keygen for JProfiler x64 license key is illegal and prevent future development of JProfiler x64. Download links are directly from our mirrors or publisher's website, JProfiler x64 torrent or shared files from free file sharing and free upload services, including Rapidshare, MegaUpload, YouSendIt, SendSpace, DepositFiles, DivShare, HellShare, HotFile, FileServe or MediaFire, are not used.
Post JProfiler x64 review


Windows 7 JProfiler x64 related downloads

JProfiler by ej-technologies GmbH is the ultimate tool for ... a must-have for anyone looking to optimize their Java applications. JProfiler offers real-time performance analysis, thread profiling, memory ...
The application Bio7 x64 is an integrated development environment for ecological modelling with a main ...
The Android NDK x64 is a companion tool to the Android SDK ... APIs, you probably do not need the NDK x64. Read What is the NDK? for more information ...
Integrate TexturePacker x64 in your build toolchain or add it directly ... rebuild all sprite sheets with changes. TexturePacker x64 is the first tool which has direct support ...
CompareData x64 is a native Windows cross-dbms application that allows you to visually compare and ...
My Account
Help
Windows 7 Software Coupons
-
WinX MediaTrans
63% Off -
MacX DVD Video Converter
58% Off -
Media Player Morpher
85% Off -
MacX MediaTrans
63% Off -
FREE VPN PROXY by SEED4.ME WINDOWS
Free VPN by Seed4Me
My Saved Stuff
You have not saved any software.
Click "Save" next to each software.
Click "Save" next to each software.
Would you like to receive announcements of new versions of your software by email or by RSS reader? Register for FREE!
Windows 7 Downloads Picks
- Software Ideas Modeler Portable 15.31
- Software Ideas Modeler Portable x64 14.55
- QuickRev 1.10.2
- Portable RJ TextEd 4.18
- ExamDiff Pro 16.0.1.23
- Qt Creator 19.0.1
- Microsoft Visual Studio 2022 17.10.3
- Windows Phone Developer Tools 1.0.1
- Adobe AIR SDK for Linux 51.2.2.5
- Geany Portable 2.1
- Open Validator 2.5.2
- NCache Enterprise Edition x64 4.4
- Syncro SVN Client x64 10.1 B2015040812
- Google App Engine SDK 1.3.8
- DOSBox 0.74.3
- Java Runtime Environment 64bit 10.0.2
- BlueJ Portable 5.1.0
- XN Resource Editor Portable 3.0.0.1
- Adobe Photoshop SDK CS6
- Prey 2.16.1
Popular Tags
sql server
html
software
code protection
software protection
decompiler
xml
net
visual basic
visual
development
java
obfuscator
windows
file
sql tools
dll
programming
edit
visual studio
tool
sql
view
sql tool
database
vb net
uml
editor
code security
obfuscation
Popular Windows 7 Software
- Simply Fortran 3.41 Build 4438
- PHP 8.5.5
- dotConnect for MySQL Professional 10.1.35
- dotConnect for Oracle Professional Edition 11.1.33
- Miraplacid Text Driver SDK 8.0
- Turbo C++ 3.0
- dbForge Documenter for SQL Server 2025.3
- Windows Installer 4.5
- StyleControls 5.86
- Software Ideas Modeler Portable 15.31
- Free OCR C# 2022.8.7804
- Windows Post-Install 8.7.2
- Review Assistant 4.3.11
- Java SE Development Kit (JDK) 8 Update 221
- Code::Blocks for Windows 20.03 Build Apr 3 20
© 2026 Windows7Download.com - All logos, trademarks, art and other creative works are and remain copyright and property of their respective owners. Microsoft Windows is a registered trademarks of Microsoft Corporation. Microsoft Corporation in no way endorses or is affiliated with windows7download.com.