


PerfMonitor for Windows 7 - "Monitor PC Performance: Get PerfMonitor" - Windows 7 Download

PerfMonitor 2.04
Boost your PC's performance with this must-have software. Get real-time monitoring and analysis for effective optimization.
Windows 7 users, are you looking for a reliable tool to keep track of your CPU performance? Look no further than PerfMonitor by CPUID! This sleek software offers real-time monitoring of your system's vital stats, with detailed graphs and reports to help you pinpoint any issues. Plus, with customizable alerts and a user-friendly interface, PerfMonitor makes it easy to elevate your PC's performance to the next level. Try it out today and experience the power of intelligent monitoring!
PerfMonitor 2.04 full details

| File Size: | 922 kB |
|---|---|
| License: | Freeware |
| Price: | FREE |
| Released: | 2014-12-26 |
| Downloads: | Total: 750 | This Month: 1 |
| Publisher: | CPUID |
| Publisher URL: | https://www.cpuid.com/ |

Download PerfMonitor 2.04
Save PerfMonitor to My Stuff
Tweet
PerfMonitor - Windows 7 Download awards


PerfMonitor 2.04 full description
PerfMonitor2 (PM2) is a processor performance and monitoring tool. It allows to track up to 4 processor-related events choosen in a model-specific list. It succeeds to PerfMonitor, and in addition to that first version, PM2 includes monitoring data, like temperatures and powers.
PerfMonitor can be used to identify the performance bottlenecks of a system, or to monitor a program for cache-miss rate or mis-predicted branches. But PerfMonitor can also be used as a hardware-level CPU comparison tool, comparing the key parameters of different CPUs runnning the same benchmark.
Install PM2 (setup version)
Run the setup executable file, and let it guide you for the installation process.
How to use PM2
Using PM2 does not require to be a hardware specialist, on the contrary it was designed to b very easy to use. Nethertheless, some basic processor notions are recommanded to use PM2 at its best.
Terminology
A processor refers to a socket or a package. It includes one or several cores. Each core consists in one or two CPUs (two in the case of the support of Hyper-Threading). A counter represents an event tracked on the processor. Depending on the event, it can be reported at the CPU level (for example CPU usage), the core level (for example core temperature), or at the processor level (for example package power).
Interface
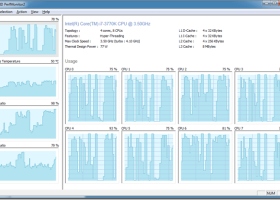
PM2 consists in two views :
The counter selection view includes 4 processor counters and allows to choose the counters to track. When possible, the data reported on these counters are at the processor level.
The CPU counter view shows the counter value at the processor, core or CPU level. It does also include basic information on the processor.
Processors, counters configurations and counters selection
Select a processor
If your system includes more than one processor, you can select the processor to monitor by selecting it in the menu Selection ? Processor. You can then view the list of available counters in the menu Selection ? Counters.
Select a counter
In the counter selection view, left click on a graph to select it. You can change the counter either by right clicking on the selected graph, and choose the counter in the menu, either by selecting it in the menu Selection ? Counters. A check will indicate the current counter selection.
Counters Configurations
The nature and the number of counters depends on the processor model and family. Some counters are using the processor 's performance monitoring features, and because performance monitoring does only allow a few number of events to be monitored in the same time, PM2 allows to switch between several counters configurations. Some counters are present in all configurations, and some others are only available with a specific configuration. The table below shows all the counters available on the supported processors. You can select the counters configuration in menu Selection ? Counters Configurations. The Selection ? Counters menu is dynamically updated to include the counters that are available in the current configuration.
Counters definition
Caches request rate and hit ratio
The cache requests rate is the ratio between the number of requests to that cache and the total number of instructions. The cache hit ratio is the ratio between the number of requests to the cache that resulted in a success (the required data was found in the cache) and the total number of requests to the cache.
Branch Instructions rate and branch hit ratio
Branch instructions rate is the ratio between the number of branch instructions (x86 jz/jnz/jg …) and the total number of instructions. The hit ratio reflects the performance of the branch prediction mechanism.
PerfMonitor can be used to identify the performance bottlenecks of a system, or to monitor a program for cache-miss rate or mis-predicted branches. But PerfMonitor can also be used as a hardware-level CPU comparison tool, comparing the key parameters of different CPUs runnning the same benchmark.
Install PM2 (setup version)
Run the setup executable file, and let it guide you for the installation process.
How to use PM2
Using PM2 does not require to be a hardware specialist, on the contrary it was designed to b very easy to use. Nethertheless, some basic processor notions are recommanded to use PM2 at its best.
Terminology
A processor refers to a socket or a package. It includes one or several cores. Each core consists in one or two CPUs (two in the case of the support of Hyper-Threading). A counter represents an event tracked on the processor. Depending on the event, it can be reported at the CPU level (for example CPU usage), the core level (for example core temperature), or at the processor level (for example package power).
Interface
PM2 consists in two views :
The counter selection view includes 4 processor counters and allows to choose the counters to track. When possible, the data reported on these counters are at the processor level.
The CPU counter view shows the counter value at the processor, core or CPU level. It does also include basic information on the processor.
Processors, counters configurations and counters selection
Select a processor
If your system includes more than one processor, you can select the processor to monitor by selecting it in the menu Selection ? Processor. You can then view the list of available counters in the menu Selection ? Counters.
Select a counter
In the counter selection view, left click on a graph to select it. You can change the counter either by right clicking on the selected graph, and choose the counter in the menu, either by selecting it in the menu Selection ? Counters. A check will indicate the current counter selection.
Counters Configurations
The nature and the number of counters depends on the processor model and family. Some counters are using the processor 's performance monitoring features, and because performance monitoring does only allow a few number of events to be monitored in the same time, PM2 allows to switch between several counters configurations. Some counters are present in all configurations, and some others are only available with a specific configuration. The table below shows all the counters available on the supported processors. You can select the counters configuration in menu Selection ? Counters Configurations. The Selection ? Counters menu is dynamically updated to include the counters that are available in the current configuration.
Counters definition
Caches request rate and hit ratio
The cache requests rate is the ratio between the number of requests to that cache and the total number of instructions. The cache hit ratio is the ratio between the number of requests to the cache that resulted in a success (the required data was found in the cache) and the total number of requests to the cache.
Branch Instructions rate and branch hit ratio
Branch instructions rate is the ratio between the number of branch instructions (x86 jz/jnz/jg …) and the total number of instructions. The hit ratio reflects the performance of the branch prediction mechanism.
PerfMonitor 2.04 download tags
PerfMonitor 2.04 Windows 7 release notes
New Release
- display Y axis labels on graphs.
- support Intel Haswell-E processors.
- support Windows 10.
- New icon.
[ PerfMonitor release history ]
- display Y axis labels on graphs.
- support Intel Haswell-E processors.
- support Windows 10.
- New icon.
[ PerfMonitor release history ]
Bookmark PerfMonitor
PerfMonitor for Windows 7 - Copyright information
All PerfMonitor reviews, submitted ratings and written comments become the sole property of Windows 7 download. You acknowledge that you, not windows7download, are responsible for the contents of your submission. However, windows7download reserves the right to remove or refuse to post any submission for any reason.
Windows 7 Download periodically updates pricing and software information of PerfMonitor full version from the publisher, but some information may be out-of-date. You should confirm all information.
Using warez version, crack, warez passwords, patches, serial numbers, registration codes, key generator, pirate key, keymaker or keygen for PerfMonitor license key is illegal and prevent future development of PerfMonitor. Download links are directly from our mirrors or publisher's website, PerfMonitor torrent or shared files from free file sharing and free upload services, including Rapidshare, MegaUpload, YouSendIt, SendSpace, DepositFiles, DivShare, HellShare, HotFile, FileServe or MediaFire, are not used.
Post PerfMonitor review


Windows 7 PerfMonitor related downloads
Network Monitor II is free indicator of the Internet connection ... determining country flag are use SSL protocol. With Network Monitor II information can be accessed without installing any ...
DiskMonitor enables a network administrator to monitor local and networked disks, graphically view usage history, receive ...
Overseer Network Monitor uses an ICMP ping command to test for ... packet loss exceeds acceptable tolerance levels. Overseer Network Monitor monitors your websites continually to ensure they're delivering ...
... HWMonitor Pro is our extended version of the hardware monitoring program HWMonitor. In comparison to its classic counterpart, ...
HWMonitor PRO is our extended version of the hardware monitoring program HWMonitor. In comparison to its classic ...
My Account
Help
Windows 7 Software Coupons
-
IObit Malware Fighter
35% Off -
Driver Booster
35% Off -
MacX Video Converter Pro
56% Off -
WinX HD Video Converter
56% Off -
WinX MediaTrans
63% Off
My Saved Stuff
You have not saved any software.
Click "Save" next to each software.
Click "Save" next to each software.
Would you like to receive announcements of new versions of your software by email or by RSS reader? Register for FREE!
Windows 7 Downloads Picks
- BlueStacks App Player 4.280.1.1002
- Windows 7
- Advanced Driver Updater 4.6.1086.5319
- BIOS Agent Plus 2.2019.1.31
- SIW 2024.14.1.0417
- Windows 7 Little Tweaker 1.2
- Copernic Desktop Search Professional 8.3.1 B16652
- PortableApps Suite 29.4
- iTop Easy Desktop 2.3.0.19
- WIDCOMM Bluetooth 6.2.1.100
- ITN Converter 1.94
- Copernic Desktop Search Home 8.3.1 B16652
- Windows 7 DreamScene Activator 1.1
- Portable Wise Registry Cleaner Professional 11.1.4 B719
- UBCD4WIN 3.6.0
- OpenLP 3.0.2
- Network Monitor II 31.5
- FCEUX 2.6.6
- Windows XP Mode (Windows Virtual PC) 1.3.7600.16423
- Fldigi 4.2.05
Popular Tags
utility
password
optimize
database
tool
print
download
search
data
web
monitor
free
windows
editor
image
security
time
file
files
convert
shareware
edit
video
software
desktop
utilities
keyboard
system
text
manager
Popular Windows 7 Software
- BlueStacks App Player 4.280.1.1002
- Windows 7 Service Pack 1 7601.17514.1011
- CPU Cooling Master - Laptop Cooler 1.6.8.8
- Windows 7
- SuperCopier x64 2.2.6.6
- Games for Windows - Live 3.5.50.0
- Ghostscript (x64 bit) 10.03.0
- Advanced Driver Updater 4.6.1086.5319
- BIOS Agent Plus 2.2019.1.31
- R-Studio for Windows x64 9.4 B191303
- UEFI BIOS Updater 1.79.17
- Avro Keyboard 5.6.0.0
- Stellar Merge Mailbox for Outlook 8.0.0.0
- Tenorshare 4uKey - Password Manager 2.0.1
- SIW 2024.14.1.0417
© 2024 Windows7Download.com - All logos, trademarks, art and other creative works are and remain copyright and property of their respective owners. Microsoft Windows is a registered trademarks of Microsoft Corporation. Microsoft Corporation in no way endorses or is affiliated with windows7download.com.